An AI That Orders You A Pizza If You're Sad
Introduction...
This was actually an idea I've had for a few years! The reason it took so long was I came up with this project when I was
barely getting into Computer Vision and AI in general! I knew what I wanted to do but I wanted to spend some time understanding
the fundamentals of how AI functions before I took on a project like this. I had forgotten about this project until I found
an old note entitled Pizza AI on my computer which had notes of how I wanted this project to function! Needless to say,
I am finally at a point in which I am confident in my abilities to create functioning AI (and how to troubleshoot on my own), I knew
it was time to give this project a true go!
Using facial recognition software and a neural network, I went ahead and created an AI that will automatically order you a pizza if it
detects that you're feeling sad. Here's how I did it! And if you're a more of a visual person, I also created a YouTube video that also
goes over this project, so feel free to check that out if you'd like!
Building the Mood Detector
One of the first parts I had to create for this project also ended up being the most important parts. I needed to create a way for my AI to be able to detect if a person is feeling sad to begin with. In other words, I had to build a mood detector. The biggest hurdle I faced with this was trying to find a database that I could use. I was simply looking for a database that had a series of public photos displaying different emotions. Ideally, the emotions would be labeled but I was fine with anything as long as it was good quality. I found a lot of good reosurces, however, a vast majority of them were hidden behind an "academia paywall". What I mean is, I wasn't able to have access to any of the datasets unless I was in sort of academic field and I was doing research specially related to mood detection and/or creating AI to analyze peoples moods. As annoying as this was, I was able to find a website on kaggle.com -- 'ol reliable.
This was a great dataset to use because it already came with thousands of labeled images of portrait images with the mood the person is depicting in the image. In a first world problem of sorts, there was actually a bit too much data. With this dataset, the person in the image was able to display seven different emotions.
| Label | Emotion |
|---|---|
| 0 | Anger |
| 1 | Disgust |
| 2 | Fear |
| 3 | Happy |
| 4 | Sad |
| 5 | Surprise |
| 6 | Neutral |
Creating the Neural Network
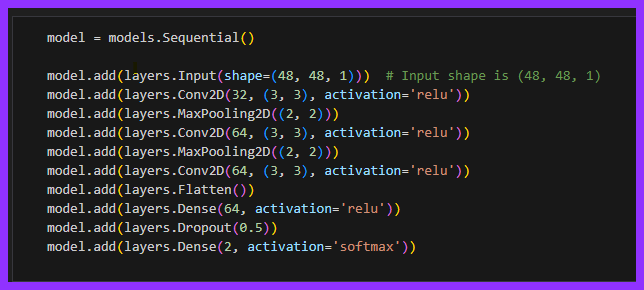
Now that I have the data, it's time to start to build out the actual model itself. For this, I'm going to use Python. More specifically, I'm going to be using the tensorflow models. Given the fact that this is a project that heavily uses ComputerVision, it's best to use a convolutional neural network. Convolutional Neural Networks (CNNs) are useful when using images due to the fact that it's very good at extracting specific features found in images.

As you can see, I used a series of convolutions and pooling layers to train this model which is pretty typical for this type of model.
Something to point out is the fact that I made a note stating that the input shape is (48, 48, 1). These dimensions
represent the dimensions of that the training data is stored as; 48x48 grayscale images. The picture below is an example of one
of the "Happy" images.

Dealing with Overfitting Data
While normally we would be happy with a surplus amount of data, I was worried that having so many specific categories would lead to overfitting. Overfitting is what happens when you create a model that is a bit too catered to the training data. This is problematic because if we introduce new data that is a bit different from what we trained our model on, our model might not know how to interpret it which may lead to bad results.
To try to get around this issue, I decided to reduce the seven categoes into only two categories - Happy and Sad. For this project, I didn't really care if a person was feeling "Surprised" for example, I only needed to know if the person was feeling sad or not. From there, I immediately had to deal with another slight road bump. What was the best way to group the categories together? After some thought, I came up with three different groupings and I was going to train models for each three and whichever had the best results was going to be the model we would use going forward.
Angry, Disgust, Fear, and Surprise in the "Sad" category
and have the rest be "Happy"
Angry, Disgust, Fear, and Surprise in the "Sad" category
and have the rest be "Happy" but drop Neutral
Happy and Sad
As one might suspect, I used Python to relabel all of the data before training them based on the models criteria. If we look at the training plots for each of the models, we can see something pretty interesting. The model that drops all of the faces except for the happy and sad ones appears to produce a better model when compared to the other two models that try to group the different labels together. We notice this because both the training and validation accuracies seem to increase at a decent pace in a similar fashion.

So what does it mean when the validiation accuracy appears to flatline while the training accuracy increases as is shown in the first two models? Well this means that the model is beginning to overfit! The model is starting to pick up on more and more specific characterstics that aren't all that helpful when trying to identify new data. It's for that reason that the model "seems" to get better but if we try using it in practice, it's not that good.
We can take a look at the actual metrics of each model to better understand the performances after 10 epochs.
| Model | Loss | Accuracy |
|---|---|---|
| 1 | 0.5377 | 0.7377 |
| 2 | 0.5261 | 0.7490 |
| 3 | 0.3453 | 0.8506 |
The metrics help confirm what we already expected by looking at the plots. Dropping all of the data except for the Happy and Sad values yields the best results.
Using Our Own Data
So now that we have a model, it's now time to try to use our own data with it. This step is not usually one that you highlight, but rather, it's one that you just "do". However, there is a pretty cool transformation involved with this step that I really wanted to show off!
Remember how I stated that all of the training data was formatted as a 48x48 grayscale image? Well, that means that every image that we input also has to follow in the same format. That means, if we want to use our own data, we have to make sure that it's also a 48x48 grayscale image. It would be too much work and an inconvenience to have to manually reformat every single image to fit this criteria. Plus, we want to eventually use this model on live footage.
To fix this, we can run some facial recognition software to find the location of the face within the image itself. Once we find the face, we can create a border around it. From here, we can then resize the image to map the new dimensions as well as transform the image from a standard RGB image to a Grayscale picture.


Before FR Transformation | After FR Transformation
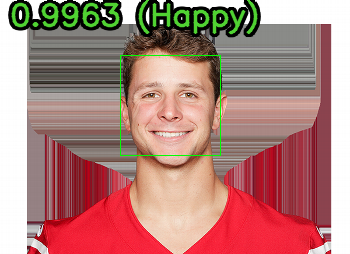
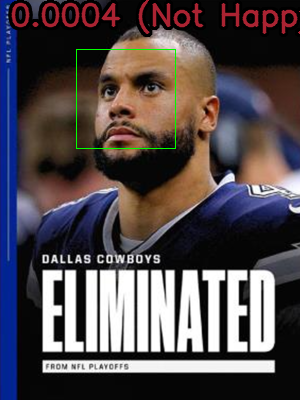
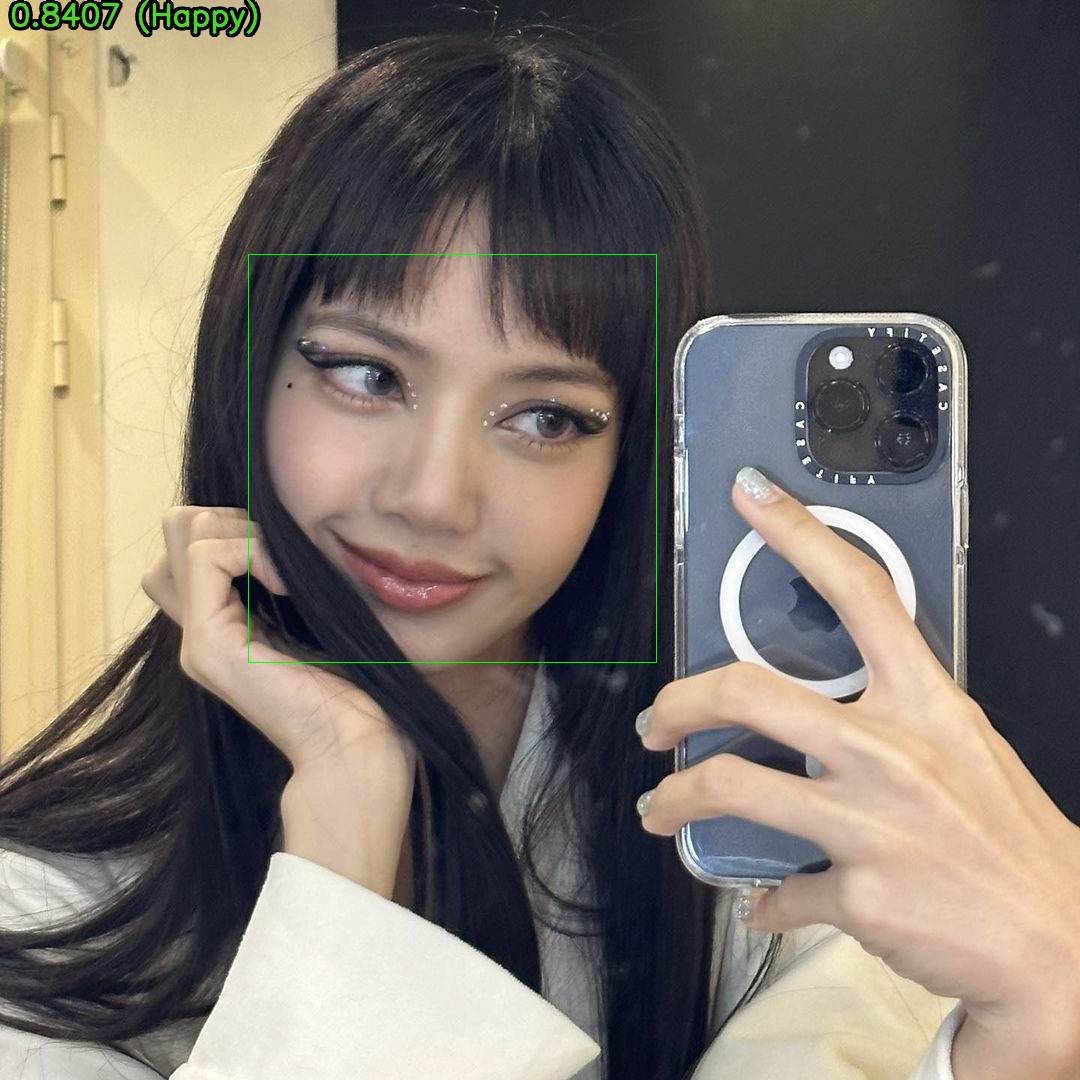
With the transformation complete, we can finally start applying our own images into model that we trained earlier! To begin testing, I simply found some celebrities online and ran their static images through our model. I made it in the way so that the predicted values are super imposed on the image itself so that it's easier to read. Here are some of the results:


Calculating "Happy" Values
I feel like at this point, I should probably explain exactly what these values mean and how I quantified something as abstract as happiness. The way I went about it is pretty straightforward; I simply programmed my model in a way that it the value it gives us how confident it is that the person in the picture is happy. If we take a look at the first image for example, the one of San Francisco 49er's Quarterback, Brock Purdy, we can see that he has a value of 0.9963 and is classified as happy. In English, this means that our model is 99.63% confident that Brock Purdy is happy in this picture.
We can compare this to the second image, and we can see that Dak Prescott has a value of 0.0004 and is classified as "Not Happy". This number tells us that the model is 0.04% confident that Dak is happy in the image. In other words, the model is 99.96% confident that Dak is sad in this image. It would make sense given this is a picture that represents his feelings of being eliminated from the NFL Playoffs, nobody is happy when this happens.
So how exactly do we use these values to classify the images. I simply just created cutoff values. If the model is over 80% confident that the person in the image is happy, then we'll classify them as happy. If the model is less than 20% confdient that the person is happy, then we can classify them as sad. Anything in the middle, and we'll mark them as neutral. I spent a bit of time trying to find the best thresholds and I found that this was the best range and gave me the most conistent results.
Using our Webcam
Okay, so we now have a model that can predict if a person is feeling happy or not, but only via images. How are we going to hook this up to our webcam and try to get live results? Well the answer is actually pretty easy! Given the fact that a video is just a bunch of images in rapid succession, we can simply have our model iterate through every frame of the webcam video and keep updating the "Happy Values".
From here, all I did was keep track of how many frames in a row my model thinks that the person in the video is sad. For my test, I set a threshold of 100. This means that if the model thinks that the person in the video is sad for over 100 frames, then we can have it fire off some code to do whatever want. In our case, if we reach 100 "sad frames", then we can run some code to order some pizza!
Ordering Pizza with Python
There's a bit of a running joke in the coding community that there's a library in Python for everything. As much as I would love to break free of this stereotypes, it Unfortunately rings free for this case. What I'm saying is that there already exists a Python Library that will allow you to order pizza using code. A link to the Github Repo can be found by clicking the following link:
I won't go into too many details as to how the code works as all the information can be found on the Github, but I figured I could go over some key pieces of information. So the way this API works is you start off by giving some preliminary information such as your name, address, and card information. It starts by using your address to find the closest Dominos. From there, we can use the API to search the menu of that specific store. This is important because there may be region specific orders that we may want to look at. However, what we really want is to know that the unique ID is for the items at the store. Everything from the drinks, pizza's, and even the side salads have a unique ID associated with them -- which makes sense! What we need to do is find the ID of the items we want to order so that we can, well, order them. For this trial, I simply wanted as specialty 12in Pepperoni Pizza which has an ID of "P12IPAPX".

With the ID we can add it to our virtual order. Once we're satisfied with all of our listings, we can then run some simple code to process the order! Since we gave our card information already, our card will be charged and the food will be ordered! In case you want to try this on your own and you're scared of spending a lot of money during the testing phase, there actually is a seetting in the PizzAPI that lets you test the code without actually charing your card.
Closing Remarks
That's about it! The only thing that's left to do is act sad in front of the camera and wait for the pizza to arrive at the address you listed before! Honestly, this project was a lot of fun and is definitely a project I am incredibly proud of. I feel like this project covers a lot of bases that are good to learn: ComputerVision, Neural Networks, API Navigation, Data Restructuring, and so much more!
As mentioned at the beginning of this thread. There is an entire video associated with this project! Please consider checking it out if you want to learn more about this project and actually see it in action! The link as at the top of this page. Thank you so much for reading!